In the reporting, the workload for the respective product can be seen for the individual workers. The workload listed in light blue is the productive portion. The green workload is the non-productive portion. Non-productive work processes are waiting times and running processes.
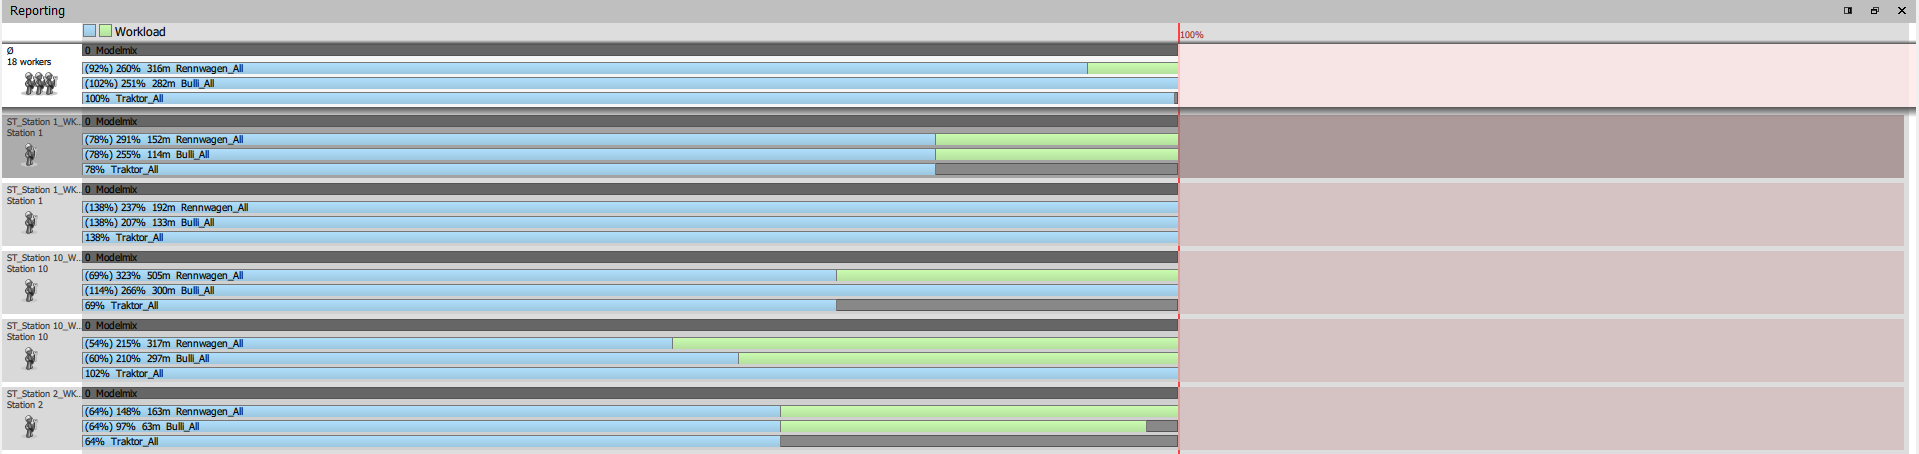
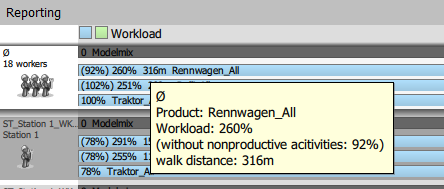
In the upper part of the reporting, an overview of the average workers is listed. When hovering the mouse over the workload, the workload as well as the non-productive activities are displayed in percent. In addition, the walking distance is displayed in meters.
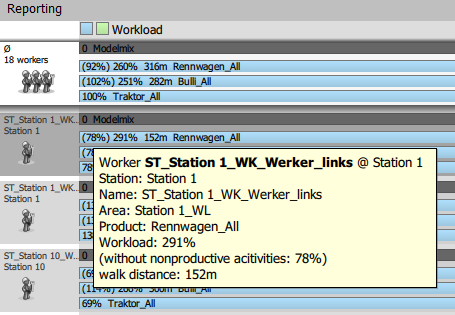
The following information is displayed for the individual workers when hovering the mouse over the workload:
- Worker
- Station
- Name
- Area
- Product
- Workload [%]
- non-productive workload [%]
- Walking distance [m]
In the Worker Gantt, processes can be re-timed and optimized.